Table
Overview
The Table feature in erm4sn provides a detailed and organized view of ServiceNow tables, their attributes, relationships, and configurations. This feature is essential for analyzing, troubleshooting, and optimizing your ServiceNow schema. This guide explains how to filter, navigate, and explore table details effectively.
The Data Density Filter allows you to focus on tables and columns containing data in your ServiceNow instance. This feature helps reduce clutter by filtering out empty or irrelevant tables and columns.
- The filter is located in the top-left corner of the Table Listing and Table Detail pages.
- Use this filter to quickly identify tables with significant data for analysis.
To enable this filter, click the green Data Density icon in the navigation bar.
Listing
The Table Listing provides a structured view of all tables in your ServiceNow schema.
- Click the > icon to expand individual branches of the table tree.
- Use the Expand All button to reveal the entire hierarchy.

This hierarchical structure allows you to explore parent-child relationships between tables and navigate through the schema efficiently.
Table Detail
The Table Detail page offers in-depth information about a specific table, divided into seven sections. A red section link indicates detected issues that may require attention.
Table and field descriptions are automatically generated from official ServiceNow documentation using AI. These descriptions are embedded directly in the UI to reduce onboarding time and improve data literacy across your team.
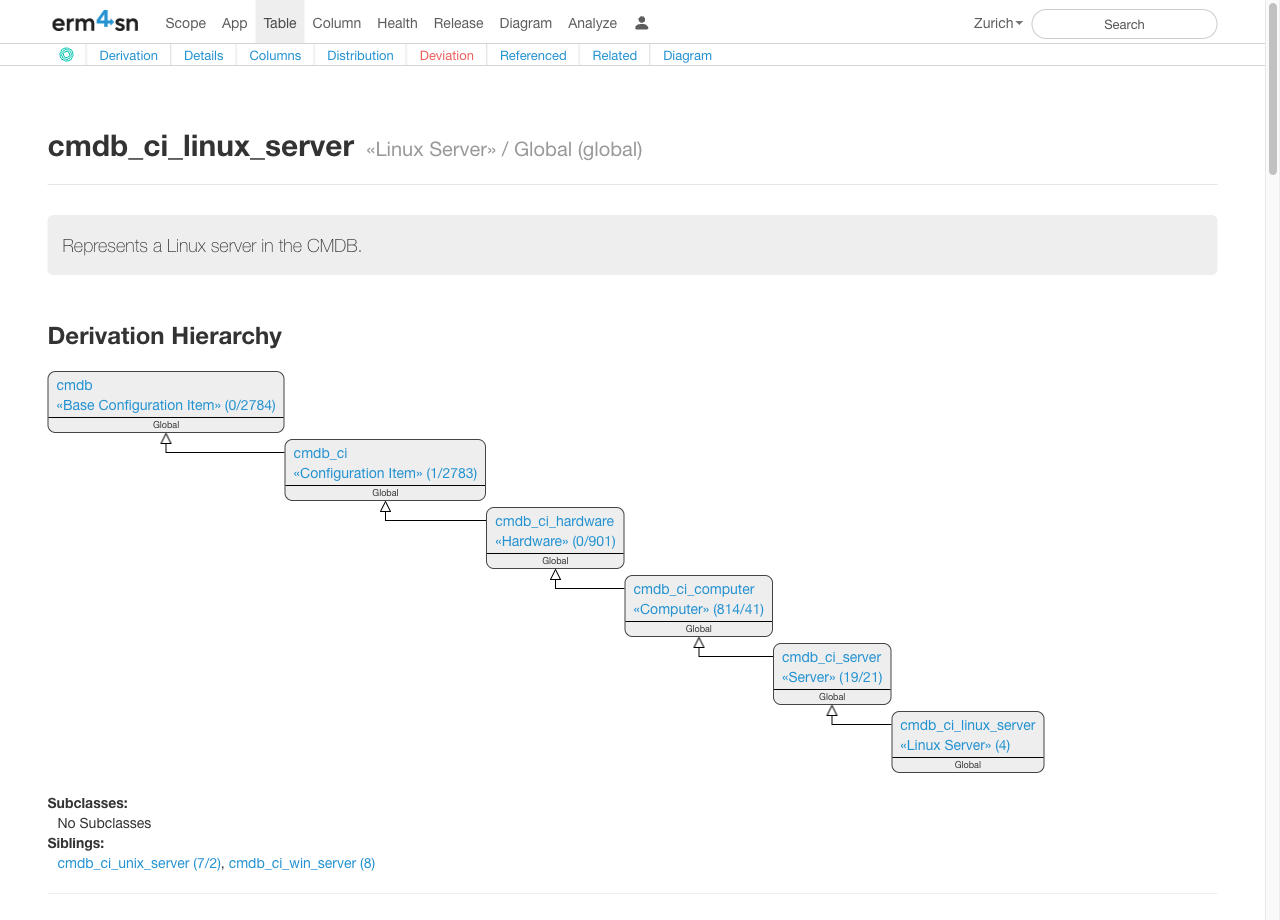
1. Derivation Hierarchy
- Displays a graphical view of the table's hierarchy, showing:
- Parent tables: Tables that the current table extends from.
- Subclasses: Tables that extend the current table.
- Siblings: Tables at the same hierarchical level.
- Use this section to understand inheritance and relationships within your schema.
2. Table Details
- Provides general information about the table, including:
- The date and user responsible for the last column modification.
- Quick navigation links:
- Listing, open: Opens the table listing in a new ServiceNow browser window.
- Dictionary, open: Opens the table dictionary in a new ServiceNow browser window.
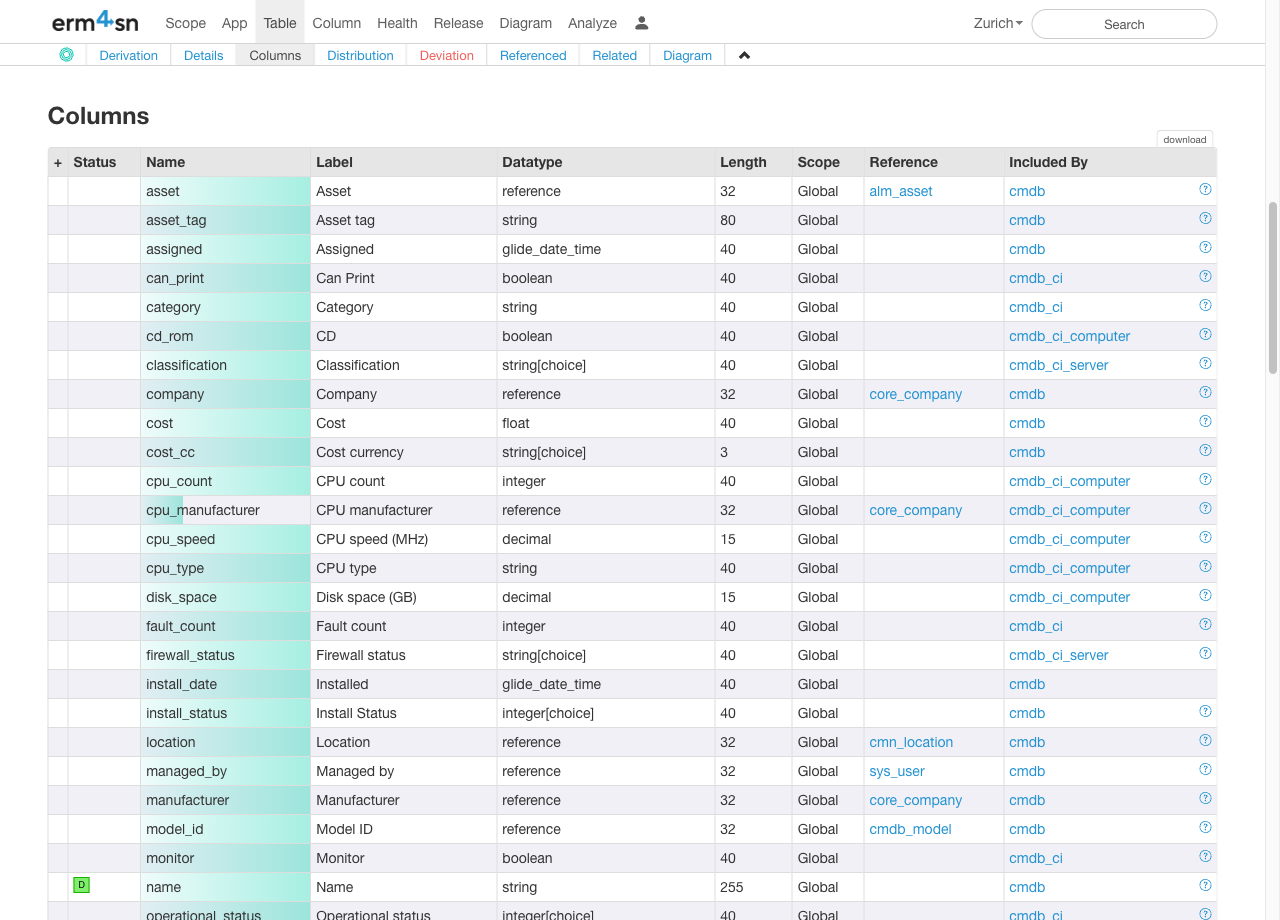
3. Attributes
- Displays a complete list of attributes for the table.
- Included By: Indicates where each attribute is defined (e.g., in parent tables).
- Sorting: Click on the header row to sort attributes by name.
- Download: Click Download to export an Excel sheet with all attribute details.
- Use the + icon in the first column to view tracked changes for an attribute.
4. Table Distribution
- Shows whether the table exists across other ServiceNow instances.
- Provides insights into schema consistency across different environments.
5. Deviating Attributes
- Highlights attribute differences between instances.
- Click on an instance name in the header row to open a detailed Table Comparison view.

6. Referenced
- Lists all tables referencing the current table.
- Click on a table name to navigate directly to its detail view.
Diagram
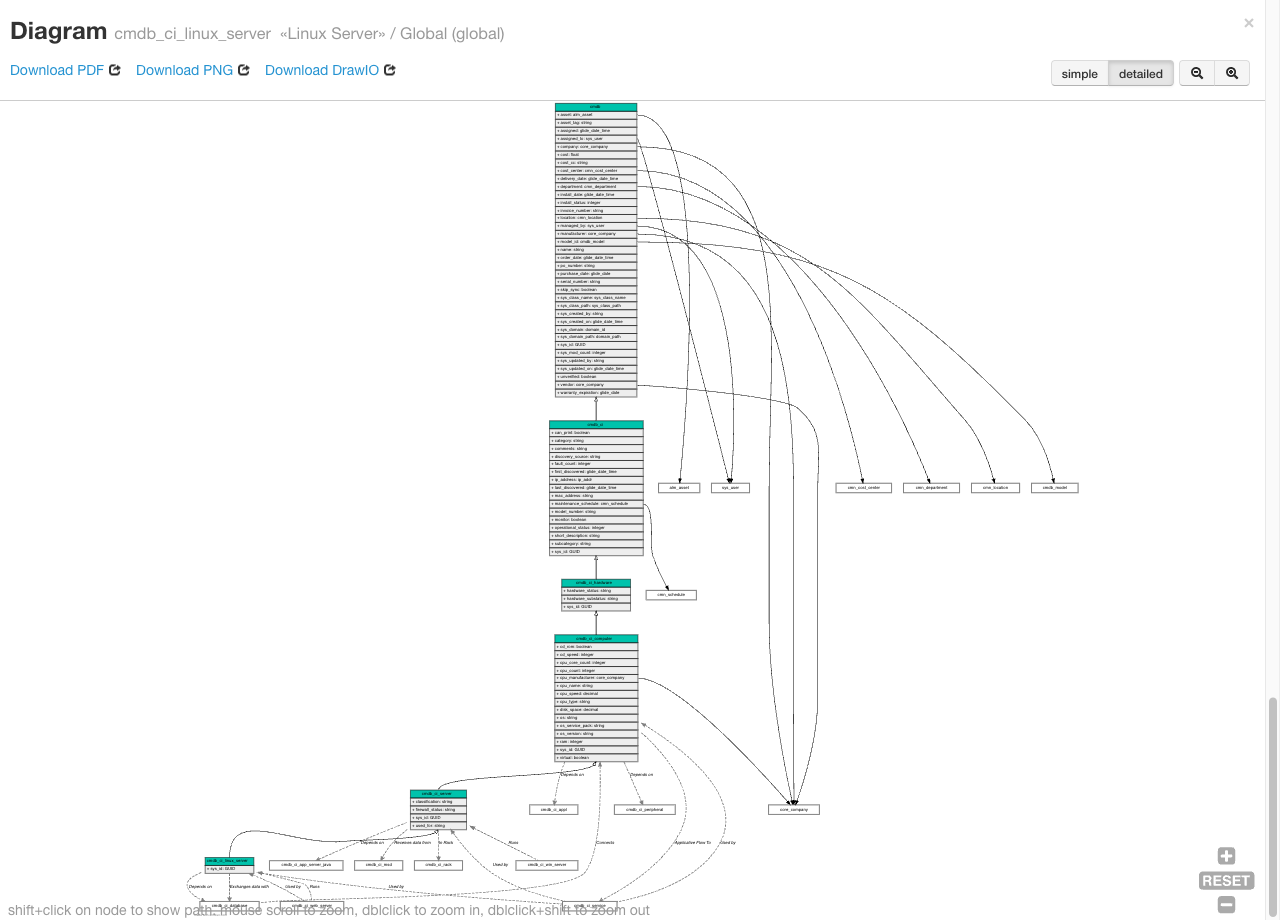
The Diagram section provides a clear and interactive graphical representation of the table's hierarchy and reference fields. This visual tool helps you understand the relationships and dependencies between tables at a glance.
- Export Options:
- Save the diagram as a PDF, PNG, or DrawIO file for further analysis or sharing.
- Click Download to choose your preferred format.
- Full-Screen View:
- Expand the diagram to a full-screen mode for better visibility and detailed exploration.
Diagram Navigation Tips
- Zooming:
- Use the mouse scroll wheel to zoom in and out.
- Double-click to zoom in.
- Double-click + Shift to zoom out.
- Panning:
- Drag the diagram to move it around the canvas.
- Node Interaction:
- Shift + Click: Highlight the path between related nodes to analyze dependencies.
- Click a table name to navigate directly to its Table Detail view.